


- Print Design


Infographic Maker
Transform complex data and information into visually impactful, easy-to-understand infographics with Kittl's free infographic maker. Whatever subject matter you're looking to present, our intuitive infographic creator offers a wide range of customizable templates and design elements to help you create stunning infographics in minutes.
Trusted by designers at

Create professional, custom infographics with ease
Whether you’re presenting research findings, creating marketing materials, or completing a school project, with our infographic maker, you can do it all. No need to spend months learning complicated design software — simply choose from our templates and add your information to create a custom infographic with just a few clicks.
How to create infographics
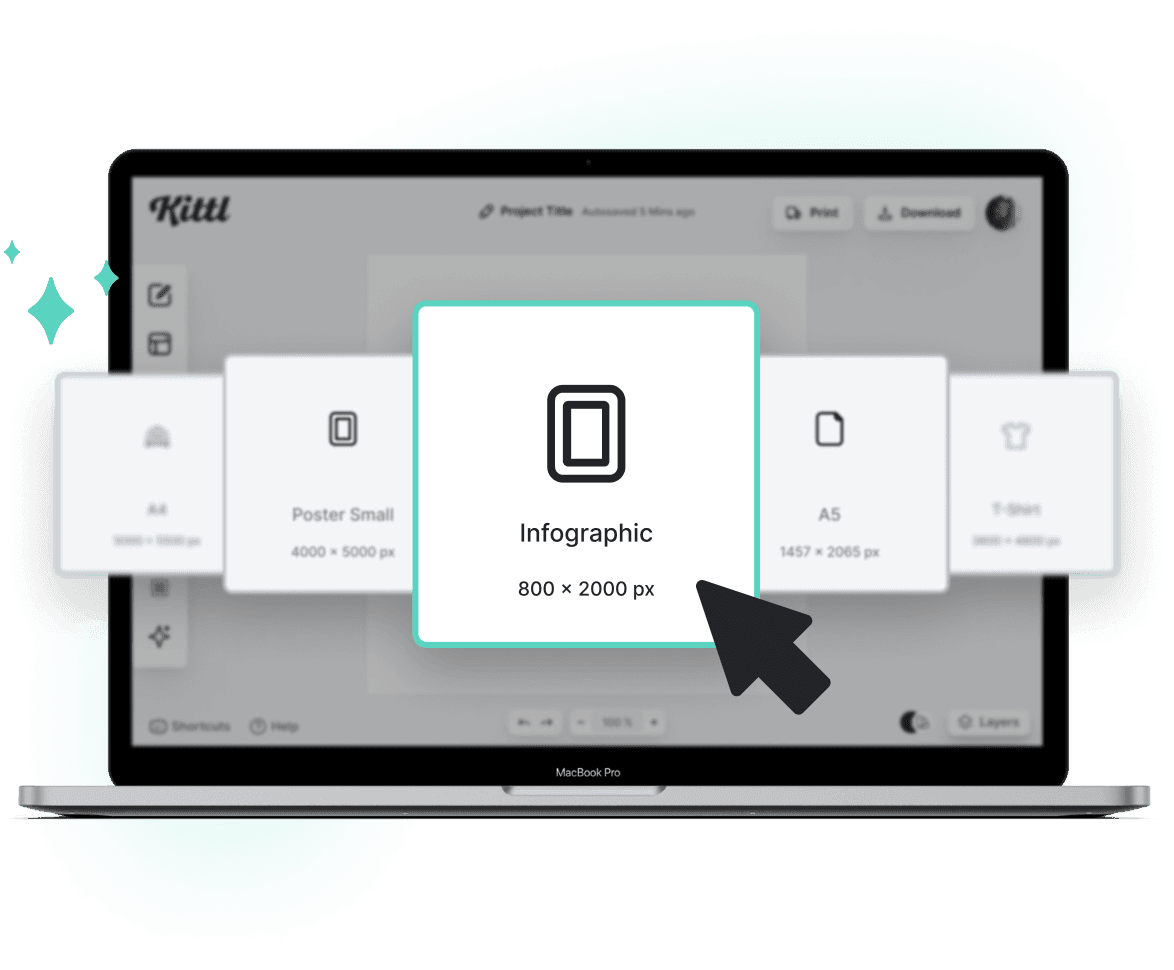
Browse Infographic Templates
Loading
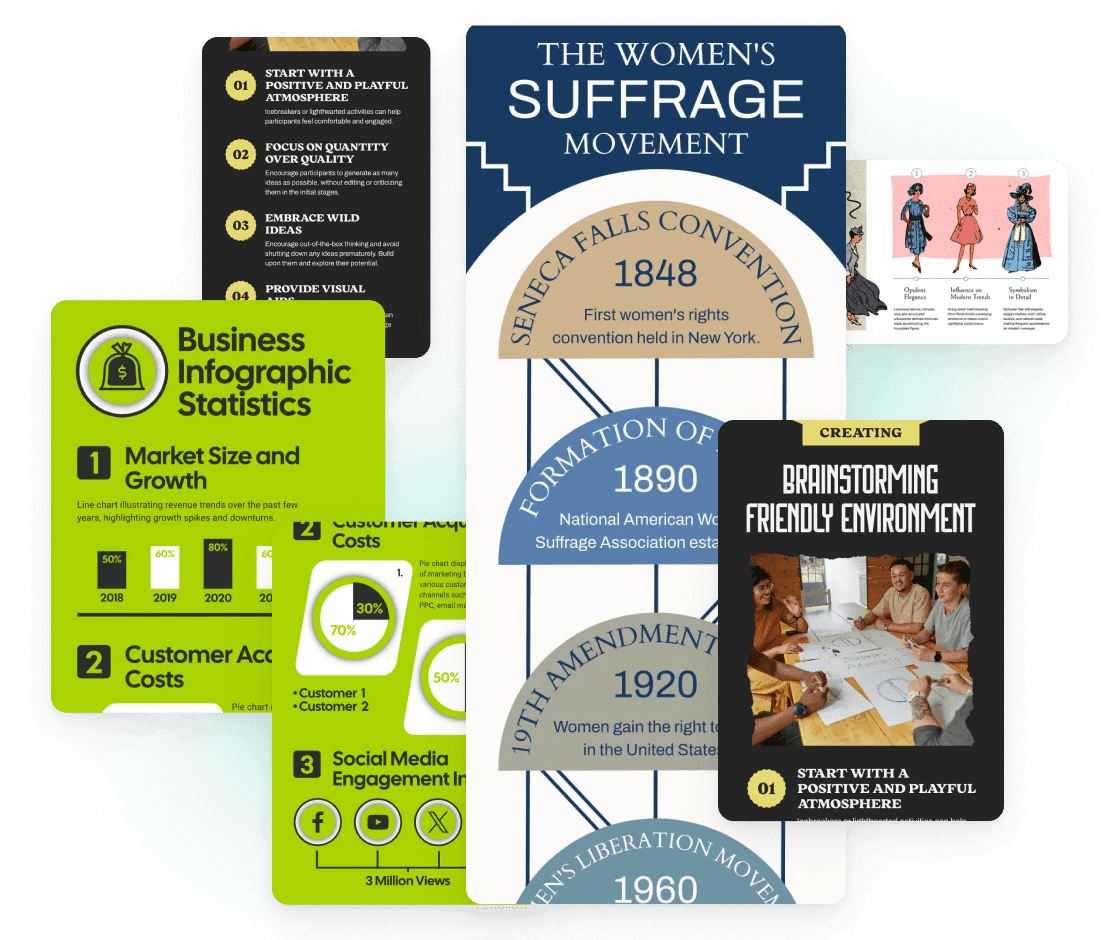
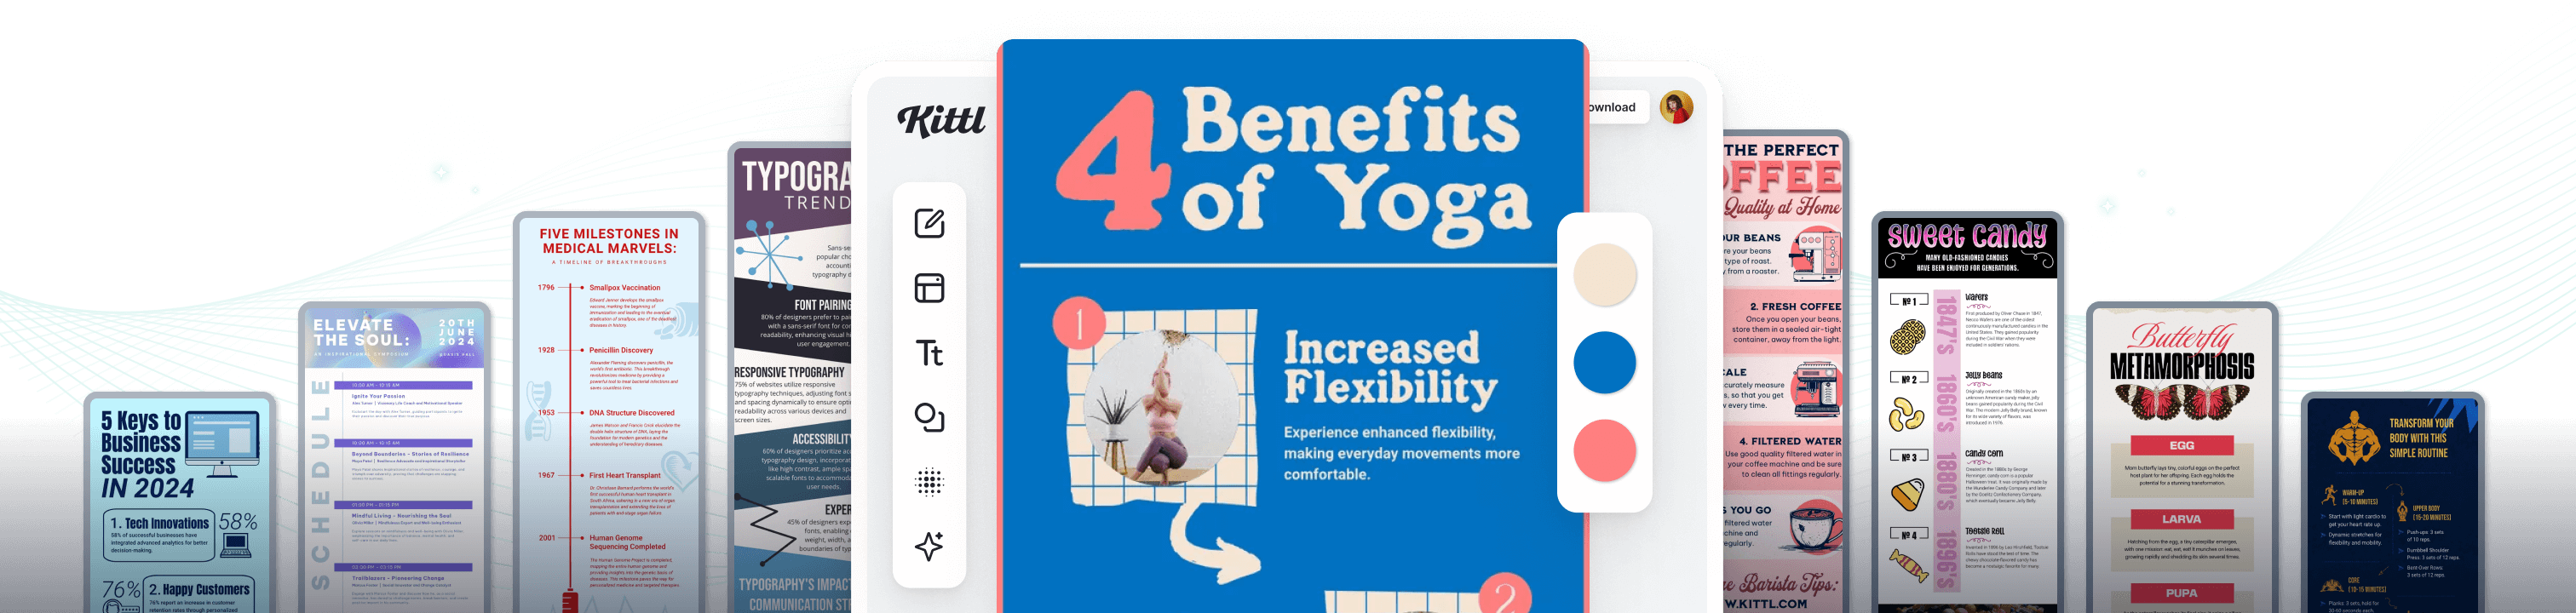
Choose a template and create stunning infographics with just a few clicks
Our infographic generator has a diverse selection of templates professionally designed for every purpose, style, and type of data imaginable. Whether you’re visualizing statistics, sharing educational content, or explaining abstract concepts, our templates provide the perfect starting point. Our meticulously crafted layouts are not only visually stunning but also thoughtfully structured to guide your readers through information seamlessly, making complex data easy to understand and engaging.
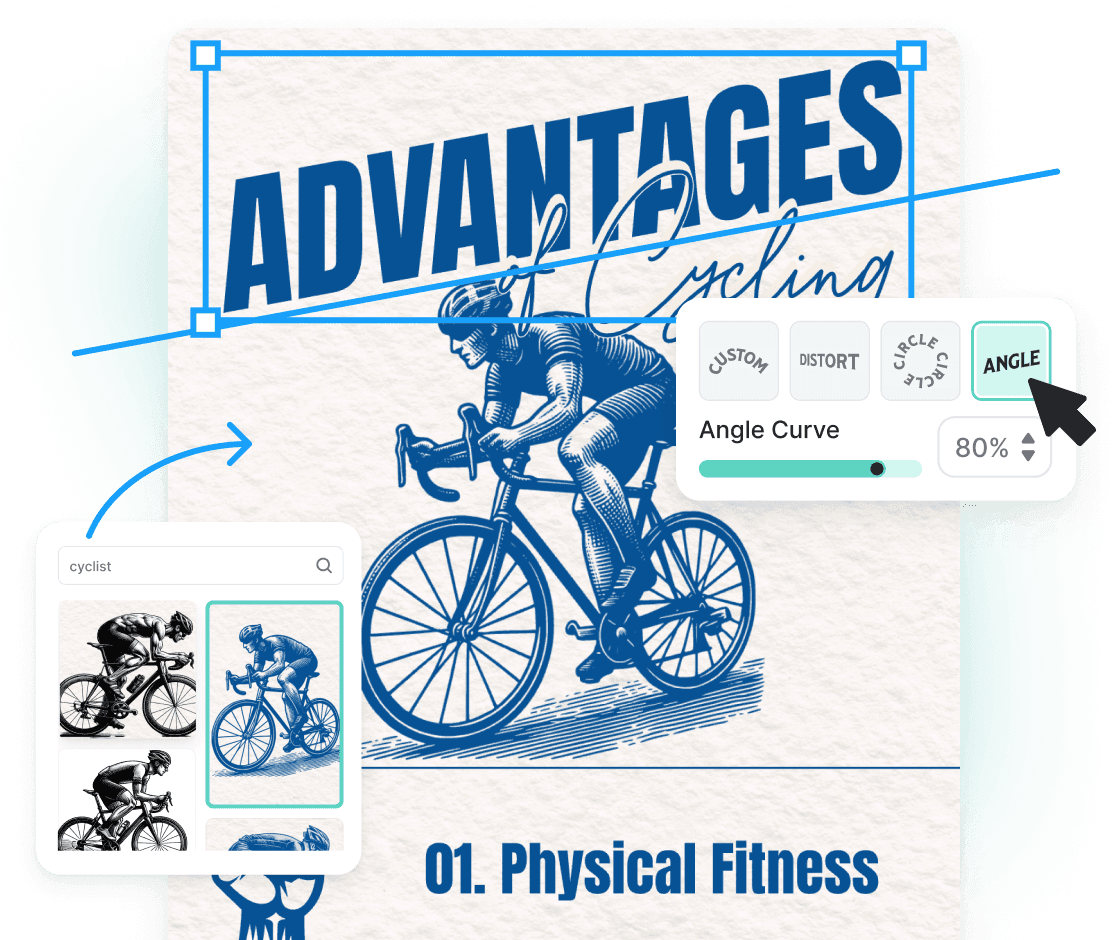
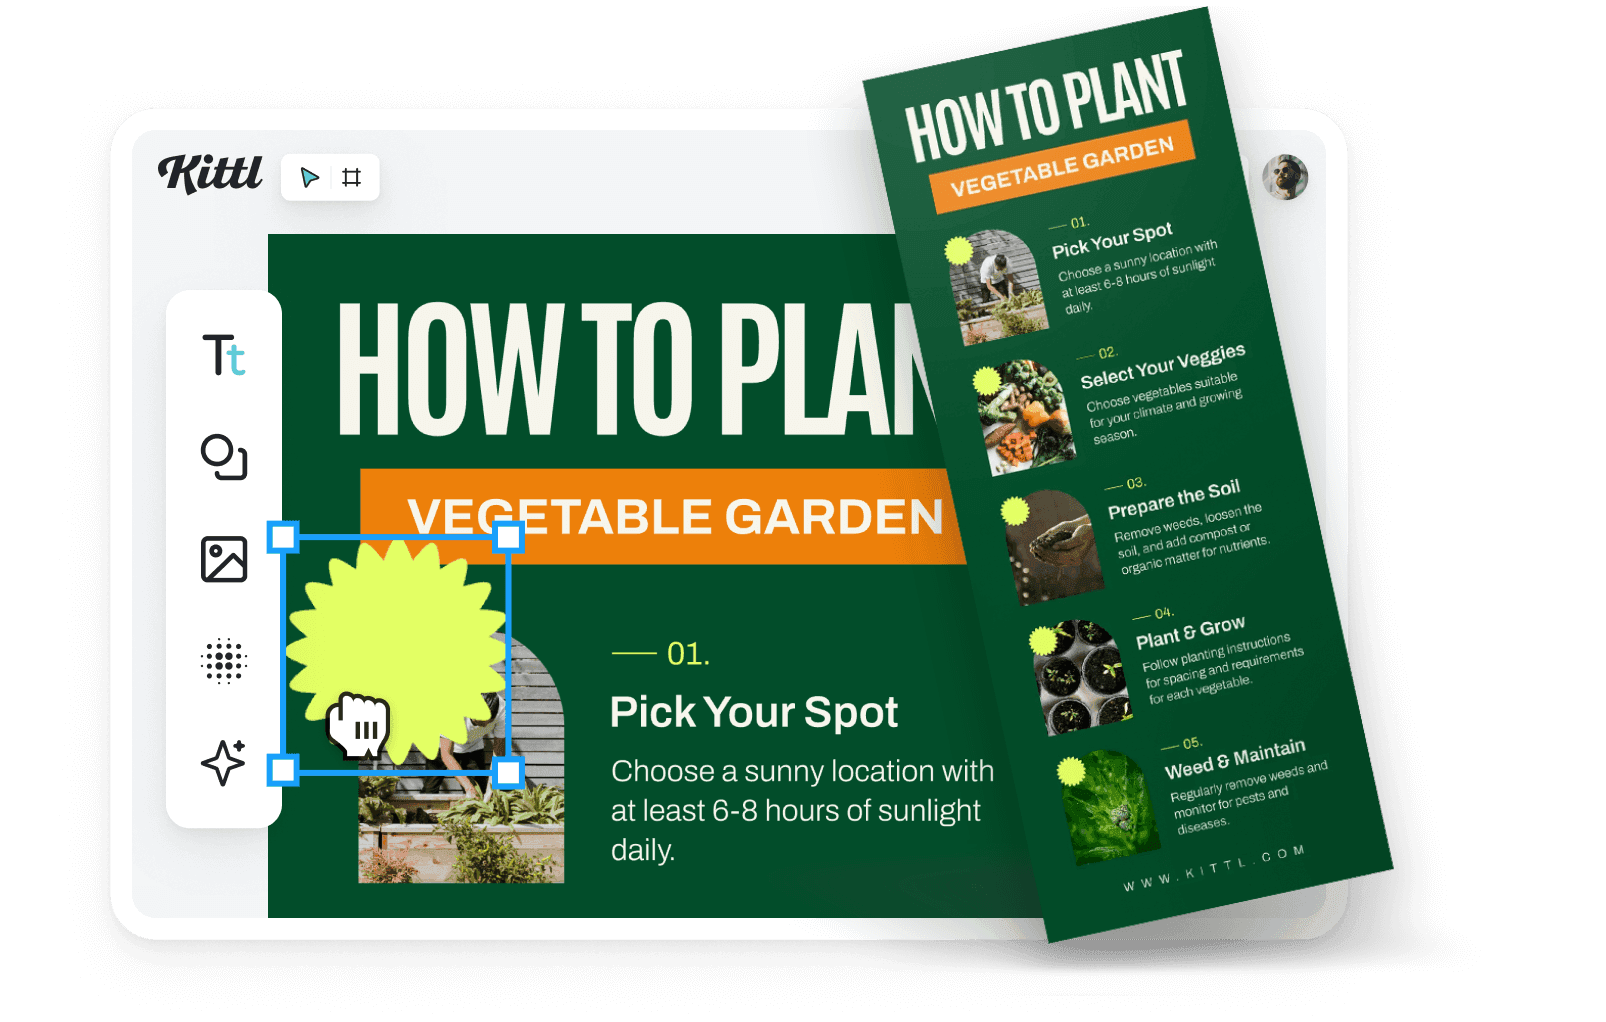
Turn your data into an exciting story with beautiful graphics and text
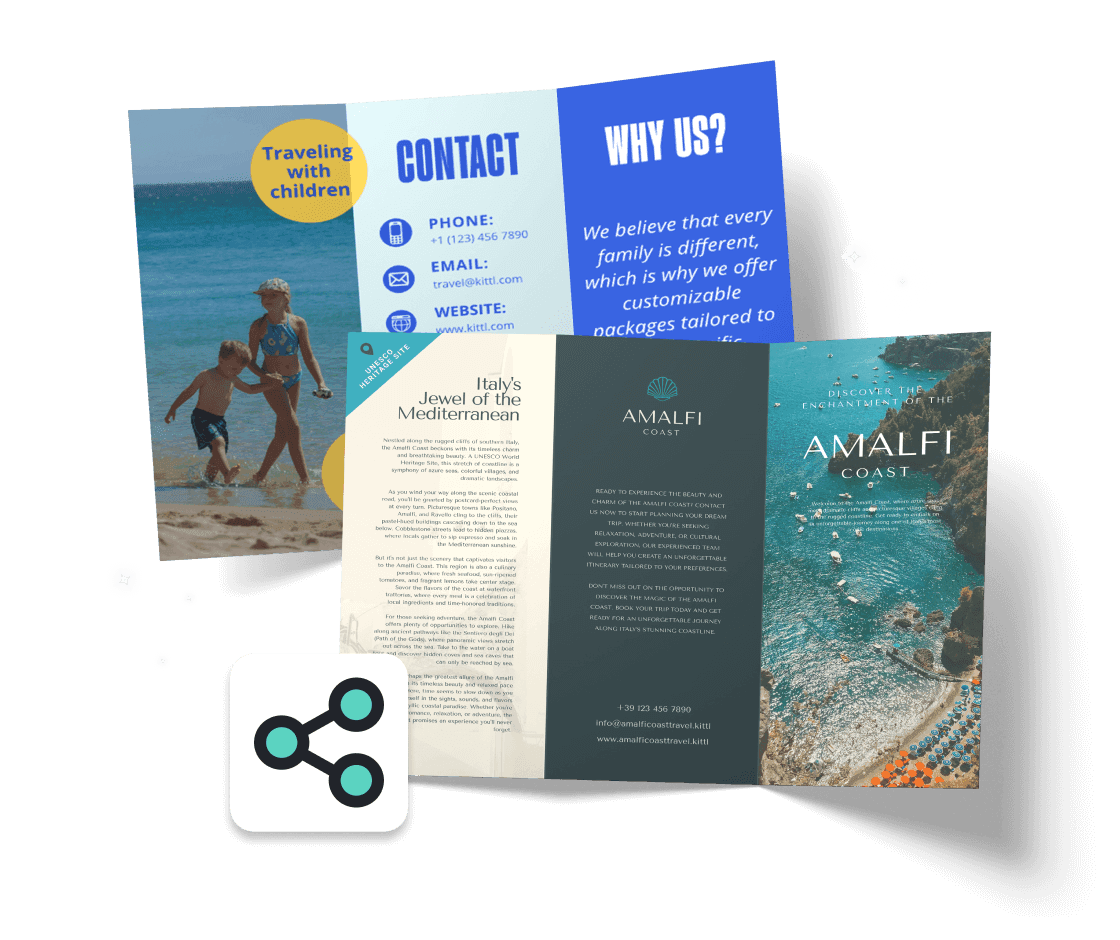
Add visual interest with icons, illustrations, and symbols. Place these elements thoughtfully throughout your infographic to guide the viewer’s eye and emphasize key points. Experiment with vibrant colors and typography to create contrast or draw attention to important information. You can also upload your own images or choose from our extensive stock library to complement your data and ensure your design resonates with your target audience.
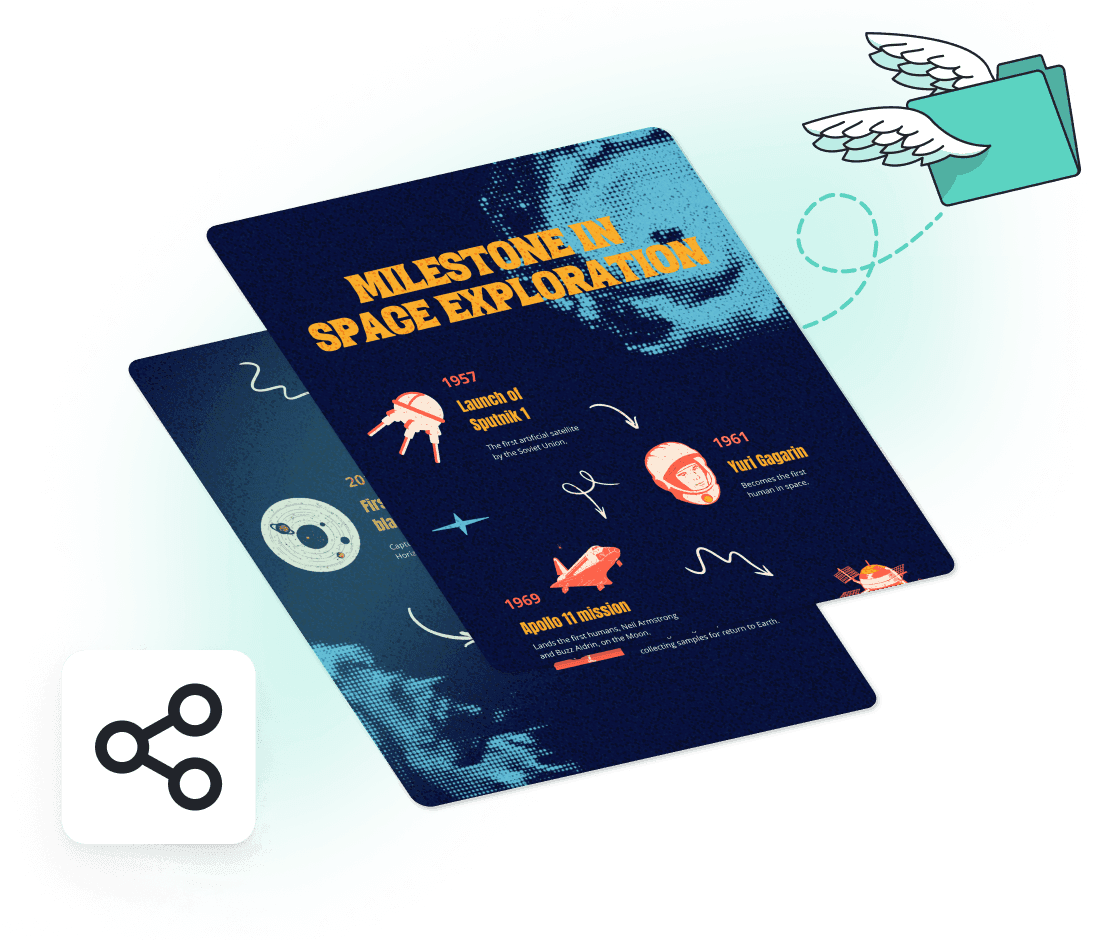
Captivate your audience with engaging infographics across channels
Share your infographic via email to reach specific segments or leverage various social media platforms to extend your reach and engagement. Infographics make excellent marketing material for blog posts, where they can visually enhance the readability of your content and increase reader interest. You can even print your infographic design to display at events, include in presentations, or distribute as handouts.
“I’ve really enjoyed creating some stunning designs!”
Will Paterson
850k+ subscribers
“Kittl makes creating new designs super easy.”
Odetta Rockhead-Kerr
1.22M+ subscribers
Frequently Asked Questions
A good infographic design clearly and attractively presents information. It needs a straightforward message backed by relevant data and visuals like charts, graphs, icons, and images. The layout must be organized to lead the viewer's eye through the information smoothly.
Create stunning infographics with just a few clicks
Making infographics has never been this fun or easy.